We ran our own container on a rented RTX 4090: NF4 crosses over at 7B, INT8 never wins
Publishing a measurement methodology is cheap; running it is not. So we rented a single NVIDIA GeForce RTX 4090 (Ada Lovelace, 24 GB) for an afternoon and pointed our own container at it — the EcoCompute energy MLCube, the same MLCube-compatible container anyone can run on their own card. Five models from 0.5B to 7B, three precisions each: 15 of 15 configurations came back as real hardware measurements (basis: "measured", measurement_source: "direct-nvml"), not estimates.
Two things came out of it that our earlier Ada data could not show: INT8 on Ada (previously we only had INT8 on A800) and 7B models (the earlier Ada anchor stopped at 3B).
What we measured
Decode-phase energy, integrated from direct NVML power samples at 10 Hz over the generation loop: 256 tokens per run, 10 iterations after 2 warmups, batch 1, greedy decoding from one fixed prompt.
| Model | FP16 (mJ/token) | NF4 vs FP16 | INT8 vs FP16 |
|---|---|---|---|
| Qwen2-0.5B | 1550.9 | +36.5% | +255.8% |
| TinyLlama-1.1B | 1619.7 | +15.3% | +143.9% |
| Qwen2-1.5B | 2200.7 | +15.7% | +186.3% |
| Qwen2.5-3B | 3558.0 | +10.1% | +138.5% |
| Qwen2-7B | 5467.9 | −29.4% | +47.4% |
NF4: the crossover is real, and it sits between 3B and 7B
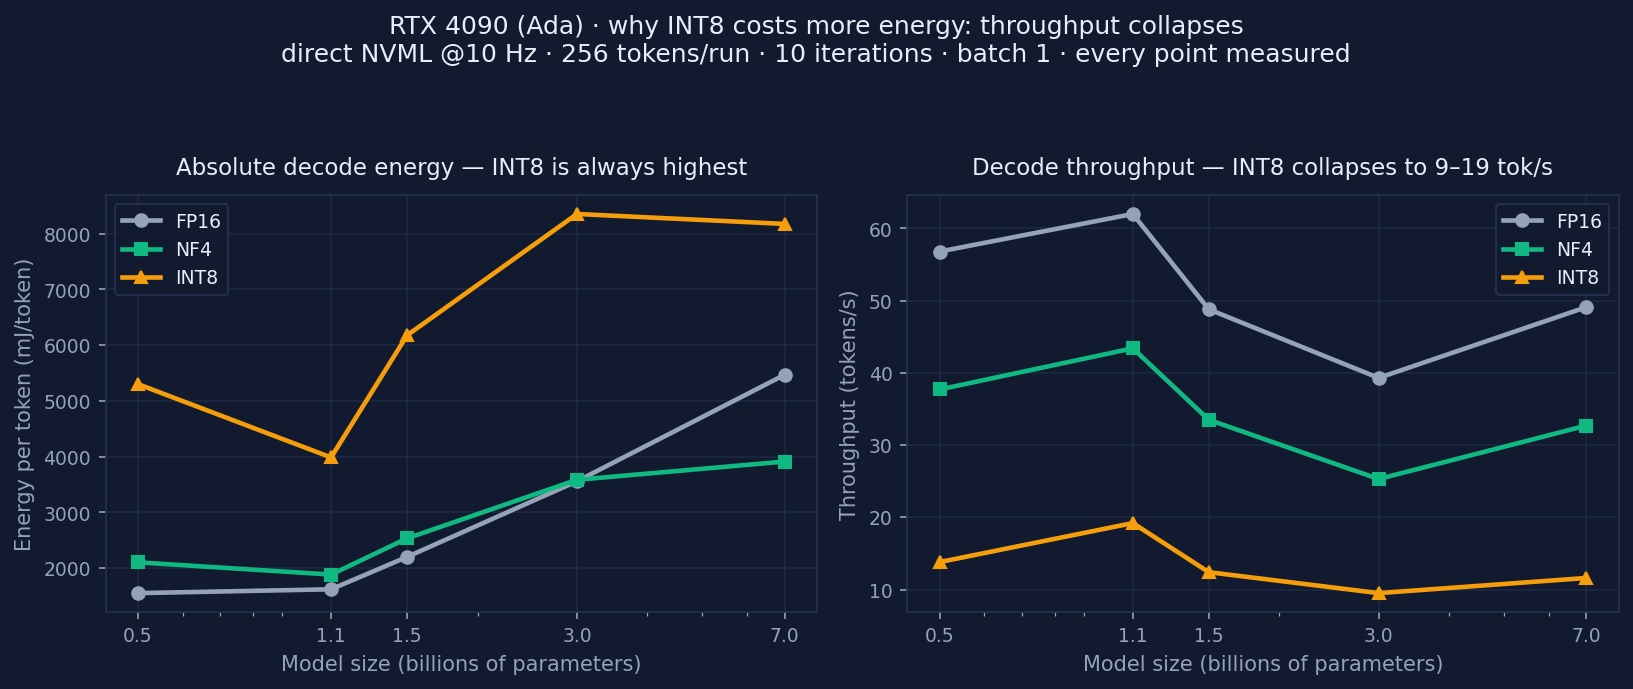
The NF4 penalty shrinks monotonically with model size — +36.5% at 0.5B, +15% around 1–1.5B, +10.1% at 3B — and then flips to a −29.4% saving at 7B. That is the crossover this project keeps arguing about, measured end-to-end on one GPU with one methodology, which is exactly the comparison that is usually missing when numbers are stitched together from different papers.
INT8: lower power, more energy
INT8 (bitsandbytes LLM.int8()) was a penalty at every size we measured, from +47% at 7B to +256% at 0.5B. The mechanism is visible in the throughput panel below: INT8 genuinely draws less instantaneous power (73–95 W vs 88–269 W for FP16), but decode throughput collapses to 9–19 tok/s against FP16's 39–62 tok/s. Energy is power × time, so a run that takes 3–5× longer loses even when it draws less power.
What this run is not
Being explicit about scope is the point of the project, so: each configuration was run once (n = 1), with the 10 decode iterations integrated into a single energy total — there is no standard deviation or CV to report yet. NVML gives GPU-package power, not whole-system wall power. The workload is one short prompt at a fixed 256-token length and batch 1, so it speaks to single-stream decode, not to batched serving. And the card is an RTX 4090, not an RTX 4090D — both are Ada, but they are different SKUs, which is why the site now lists them as separate columns instead of overwriting the older one. We publish this as a supplementary case study, not as a certified benchmark.
Run it yourself, or take the data
The container does the same thing on your GPU and writes an energy.json with the exact fields the charts on this site read:
git clone https://github.com/hongping-zh/ecocompute-mlcube.git
cd ecocompute-mlcube

python3 entrypoint.py energy_estimate \
    --model Qwen/Qwen2-7B --precision NF4 \
    --gpu_arch ada --params_b 7 \
    --output_dir workspace/outputs --share

cat workspace/outputs/energy.json
No GPU? It still runs and returns dataset-derived reference values, clearly flagged — we never dress an estimate up as a measurement. The complete run above (raw per-configuration reports, aggregated CSV, environment metadata, figures) is archived on Zenodo under 10.5281/zenodo.21528103, CC BY 4.0, and the numbers are live in the tool under GPU → RTX 4090 · Ada · 24GB. Cite that DOI for this run specifically; for the broader benchmark behind the rest of the site, cite the main dataset v1.1.0, 10.5281/zenodo.19647290 (360+ configurations, four architectures).