It was never the format. It's the kernel.
--ignore-eos, and the NVML hardware energy counter instead of an
integrated power trace. The headline moved from −63.6% to −61.9% (−63.2% for the
file MLPerf Client ships), so the suspected overestimate was real and small. One conclusion did
change, and it sharpened the argument rather than weakening it: the quantized arms do not draw
the same power as F16, they draw more. The text below carries the corrected
numbers; what changed and why is set out at the end, and the
superseded per-run CSV is still published.
MLPerf Client v2.0 shipped with signed Windows and macOS builds, agentic tasks, and a much wider hardware matrix — a lot of people can now benchmark a local LLM on their own machine without building anything. What comes out is speed: time to first token, tokens per second. Its power path is a different animal, needing a Yokogawa analyzer, SPEC PTDaemon and a second machine, so in practice a home run gives you throughput and nothing about joules.
We wrote a page about that gap last week, and it ended with a
promise: our own energy numbers were measured with transformers + bitsandbytes NF4,
while MLPerf Client's NVIDIA path is llama.cpp with a GGUF Q4_0 file, so the two
could not be read against each other; putting a GGUF path next to ours was "the next thing on our
list". This note is that measurement. It came back more interesting than we expected.
Q4_0 under llama.cpp costs 61.9% less energy per token
than GGUF F16 under the same binary, for +5.6% perplexity. On the
same card, bitsandbytes LLM.int8() costs 106% more
energy per token than its FP16 baseline. Both are weight-only quantization of a 7–8B model on
one GPU. The bit width does not tell you the sign of the energy effect. The kernel does.
What we ran
One rented RTX 4090 (Ada, 24 GB, 450 W limit), one llama.cpp build
(b10643-192067b72, CUDA 12.x), one model, three GGUF files:
Llama-3.1-8B-Instruct-F16.gguf— the FP16 baseline that a benchmark suite of already-quantized models cannot give you;ours-Q4_0.gguf— quantized by us from the same weights;Llama-3.1-8B-Instruct-Q4_0.gguf— the file MLPerf Client v2.0 itself pulls for its NVIDIA llama.cpp path.
Each file was run at -n 64, -n 320 and -n 576, five times
each, batch 1, -ngl 99 -fa 1 --no-mmap -c 2048 --temp 0 --seed 1234 --ignore-eos, in
randomized order, with the GPU forced back to idle (~25 W, 27–30 °C) before every single
run. Forty-five runs, all of which exited 0 and all of whose cooldowns converged. Energy is the
NVML hardware energy counter across the whole llama-cli process; a 100 Hz
power trace is recorded alongside it and integrated as a cross-check only. Quality is a separate
llama.cpp perplexity pass over the WikiText-2 raw test set, 564 chunks at context 512,
which touches the energy figure not at all — it was measured in the first session and
not repeated here, on the same files and the same build.
The two token counts are the point. A raw process energy total includes loading the weights —
16 GB for F16 against 4.7 GB for Q4_0 — which hands the quantized arm a
structural head start that has nothing to do with decoding. Subtracting the 64-token run from the
576-token run leaves the energy of exactly 512 additional decoded tokens, with
load and prefill cancelling out. Every number below is that difference.
The third token length exists to check that this is allowed. If process energy is affine in the
token count, differencing is exact; if it is not, differencing is a guess. Fitting
E = a + b·n over all 15 runs of each arm gives R² ≥ 0.9966 and
a slope that agrees with the differenced value to the digits we print, with the intercept
(171–378 J) sitting where the weight load should be. The assumption survived its first real
test.
The numbers
| llama.cpp arm | mJ / token | tokens / J | tok/s | decode power | Δenergy vs F16 | perplexity | Δppl |
|---|---|---|---|---|---|---|---|
F16 | 4980 | 0.201 | 54.7 | 273 W | — | 7.3260 | — |
Q4_0 (ours) | 1899 | 0.527 | 155.9 | 296 W | −61.9% | 7.7364 | +5.60% |
Q4_0 (MLPerf Client v2.0 file) | 1834 | 0.545 | 173.8 | 319 W | −63.2% | 7.7366 | +5.61% |
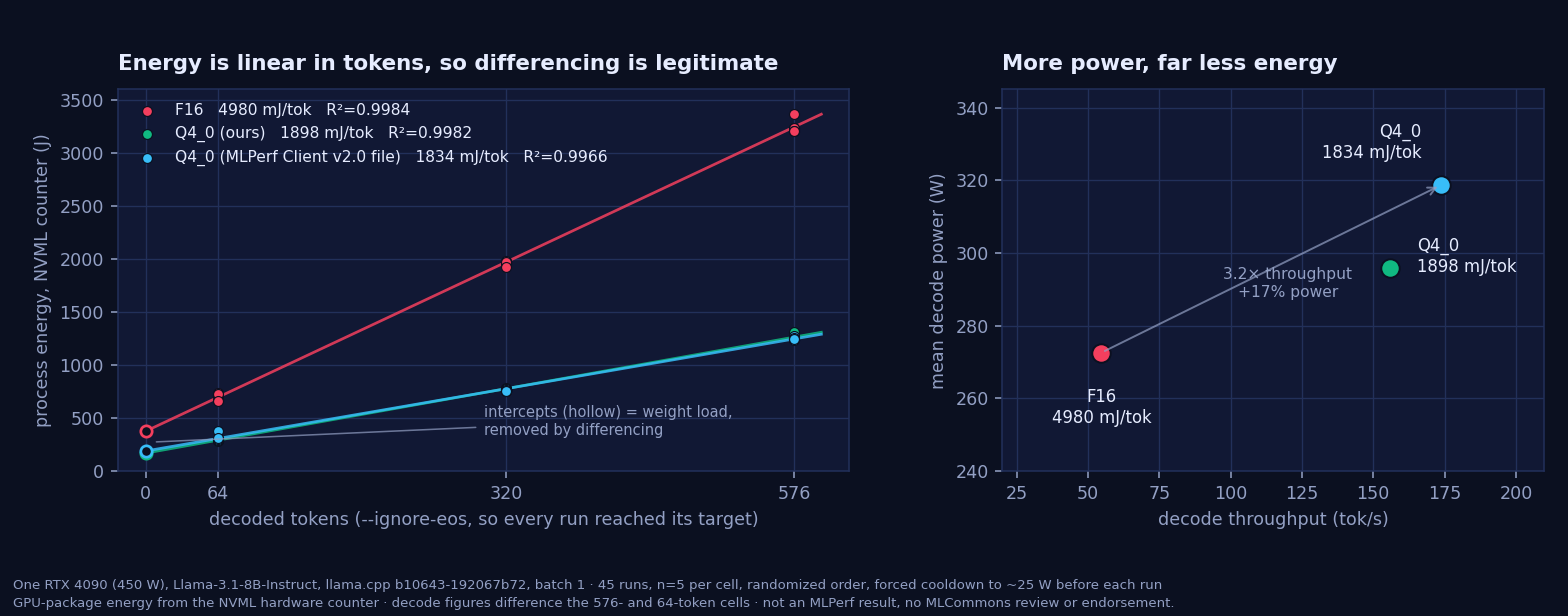
python3 build/make_v2_differencing_figure.py.The saving is throughput. The cheap arms actually draw more power.
Look at the decode power column before the energy column. F16 decodes at
273 W; the two Q4_0 arms decode at 296 W and
319 W — up to 17% more instantaneous power, on a card capped at 450 W.
They are still 62–63% cheaper per token, because Q4_0 moves a quarter of the bytes per
token and runs at 2.8–3.2× the tokens per second. Energy per token is power divided
by throughput, and here the two terms pull in opposite directions with throughput winning by a
mile.
This is the one place the clean rerun changed a conclusion rather than a digit. The first pass reported all three arms at 296–310 W and concluded "the power is the same, the speed differs"; with cooldowns and randomized order the F16 arm settles lower and the picture is sharper. A power-capped comparison would have shown none of this, and a throughput-only benchmark shows none of it either: you cannot get here without measuring both.
The same mechanism runs the other way in the case we reported for INT8: there too package power barely moved (74–91 W), and throughput fell to 0.63–0.72× of FP16, so energy per token went up. Which is the whole argument of this note:
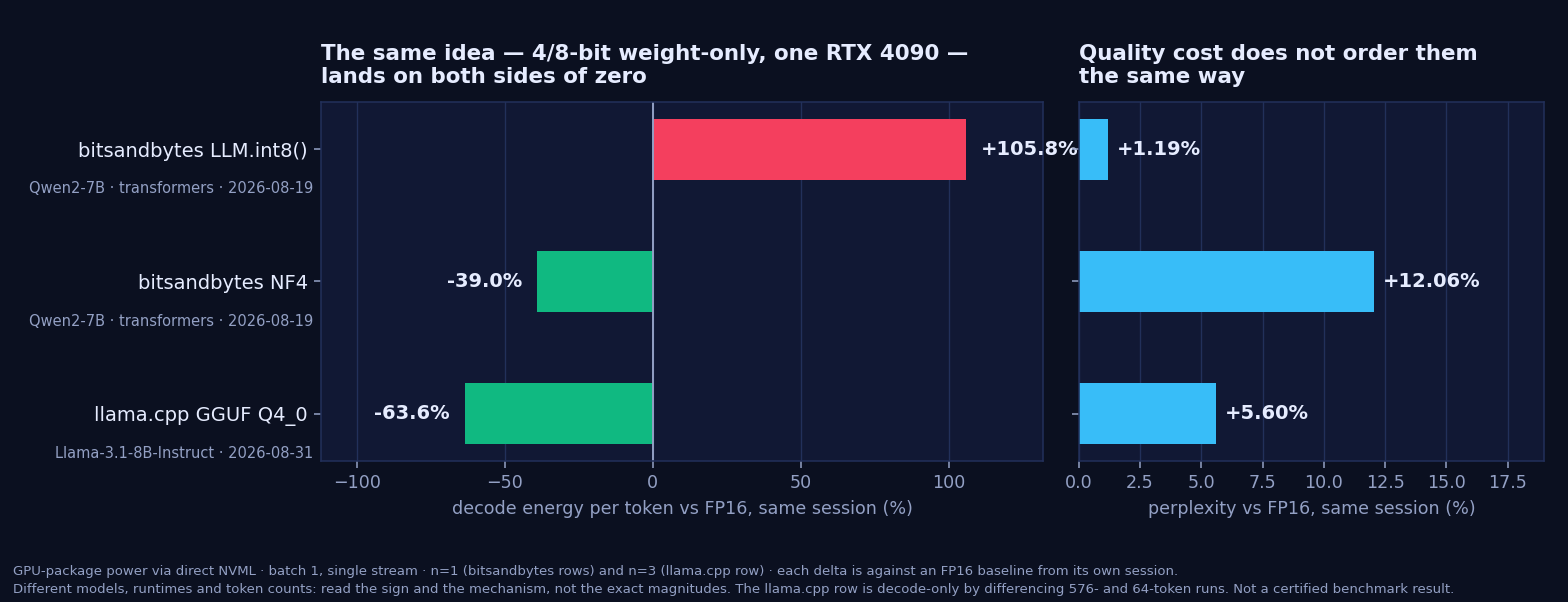
python3 build/make_kernel_figure.py.Three implementations of "keep the activations, shrink the weights", one card, and the answer
to "does quantizing save energy?" is +106%, −39% and −62% depending only on which
kernel executes the result. LLM.int8() pays for its outlier-preserving mixed-precision
decomposition in decode throughput; llama.cpp's Q4_0 path is a memory-bandwidth win on
a bandwidth-bound workload and collects nearly the full ratio. A number like "4-bit" or "8-bit"
predicts the memory footprint. It does not predict the sign of the energy effect, and anyone
quoting an energy saving without naming the runtime is quoting a property of their kernel.
The quality axis does not rescue the ranking either. Ordered by energy the winner is llama.cpp
Q4_0; ordered by perplexity damage it is LLM.int8() at +1.19%, which is
also the worst on energy. There is no single "efficiency" ordering here, which is why this site
publishes the two columns side by side and refuses to fuse them into one score.
A zero result worth publishing: our Q4_0 and MLPerf Client's are the same file, in effect
The two Q4_0 arms differ by 0.0002 in final perplexity — 7.7364 against 7.7366.
Chunk by chunk across all 564, the largest absolute difference is 0.0003, and 472 of them agree to
three decimals. On energy they differ by 3.5% in the clean run (1.8% if a single high 64-token
outlier in the shipped-file arm is dropped), against a within-cell SD of 1.3–1.8%; in the first
pass they differed by 1.4–2.3% and the sign of the gap flipped depending on which runs were
excluded. A gap that small, that unstable across sessions, is a null result, not a ranking.
So: we are not claiming our quantization is more efficient than the one MLPerf
Client ships. It isn't, within this measurement. What the comparison buys is provenance — the
numbers in the table are not an artifact of one particular GGUF file, and anyone who quantizes
Llama-3.1-8B to Q4_0 themselves should land where the shipped file lands.
What this does not show
- This is not an MLPerf result and carries no MLCommons review or endorsement. It is an independent research measurement that happens to use the same model file. MLPerf Client's own power methodology measures wall AC power for the whole system with external instrumentation; we measure GPU package power via NVML. Those two boundaries are not interchangeable and the numbers must never be subtracted from each other.
- n = 5, one card, one session. The site's own repeatability note puts run-to-run CV at a few percent but the gap between two of our sessions at 100+ points; a 62% effect is far larger than either, but the third digit is not defensible.
- The token counts are inferred, not read back. llama.cpp's timing line still
did not parse in our wrapper, so a run is credited with the tokens it was asked for whenever
--ignore-eoswas set and the process exited 0. With--ignore-eosthat is a sound assumption — and it is what removed the impossible-bandwidth artifact of the first pass — but it remains an assumption rather than a measurement. - The two energy accountings disagree by about 15% per run. The NVML hardware counter reads 14.9% higher than trapezoidal integration of the same run's 100 Hz power trace (range 2.5–31.8%). The counter is what we report, because it integrates in hardware rather than between samples. After differencing, which cancels the part that is common to both runs, the two accountings agree to 0.2–4.3% — so the headline is robust to the choice, but a reader building an at-home energy tier out of sampled telemetry should know that a 100 Hz trace is not the same instrument as a counter. Both columns are in the per-run CSV.
- Perplexity was not re-measured. The +5.6% is from the 2026-08-31 session, on the same three files and the same llama.cpp build. It is a property of the weights, not of the run protocol, but it has not been repeated under the clean protocol.
- Decode phase, batch 1, single stream, one prompt length. No prefill-heavy or agentic workload, no concurrency, no CPU, DRAM, PSU, PUE or CO₂e.
- The cross-backend comparison in the figure holds the card constant but not the model (Qwen2-7B against Llama-3.1-8B), the runtime, or the generated-token count. Read the sign and the mechanism from it, not the exact magnitudes.
If you are running MLPerf Client v2.0 this week
The two things measure different quantities and compose rather well on one machine. Run the signed client for speed on the workloads MLCommons has defined; run the container for the joules and the perplexity of a precision pair you choose, with the FP16 baseline measured in the same session:
docker run --rm --gpus all -v "$PWD/out:/out" \
  ghcr.io/hongping-zh/ecocompute-mlcube:latest \
  --model Qwen/Qwen2-7B --precision NF4 --output_dir /out
Keep the boundary in view when you put the two reports side by side: client tokens/second is a whole-system, vendor-optimized number; our joules are GPU-package only. And the container's current backend is transformers + bitsandbytes, so it reproduces the method of this note, not the llama.cpp rows — a GGUF backend, which is what would let anyone reproduce the table above with one command, is now the top of our list. All forty-five runs are in the per-run CSV linked above, with the undifferenced process energy under both accountings, the cooldown state, the first and peak power sample and the sample count on each, so you can redo the arithmetic differently; drop your own result on the replications page, especially if it disagrees.
What the rerun changed
The first version of this note, published 2026-08-31, was explicit that it was provisional and said what was wrong with it. This is what happened to each of those items:
| First pass, 2026-08-31 | Clean rerun, 2026-09-03 |
|---|---|
| 18 runs, n = 3, two token lengths | 45 runs, n = 5, three token lengths, so the differencing assumption could be tested (R² ≥ 0.9966) |
| Fixed F16 → ours → MLPerf order, no cooldown; 16 of 18 runs inherited 145–248 W of thermal tail and the two genuinely cold runs were the two largest outliers | Randomized order under a fixed seed, forced cooldown to ~25 W and 27–30 °C before every run; all 45 cooldowns converged |
| Token counts unknown; the F16 arm implied 101% of the card's memory bandwidth, i.e. it had stopped early on EOS, which inflated its mJ/token | --ignore-eos, so every run decodes its full target; F16 lands at 54.7 tok/s and a believable fraction of bandwidth |
| Energy by integrating a 10 Hz power trace | NVML hardware energy counter, with a 100 Hz trace kept as a cross-check |
| −63.6%, flagged as a likely overestimate | −61.9% (ours) and −63.2% (the shipped file) — the overestimate was real and worth about 1.7 points |
| "All three arms draw 296–310 W" | F16 draws 273 W and the Q4_0 arms draw 296–319 W — the conclusion inverts, in favour of the argument |
How the rerun was run — what each protocol fix cost and which of them moved the number — is a separate note: Re-running a number we didn't trust. The correction was also posted to the upstream feature request it belongs to, mlcommons/mlperf_client#19. The superseded CSV stays published; nothing here is quietly rewritten. The full archive of the rerun — all 45 raw run records, the measurement scripts, the environment snapshot and the model SHA-256 hashes — is deposited at 10.5281/zenodo.22295184.