MLPerf Client v2.0 measures speed. Here is how to measure the energy of the same run.
Last updated 2026-09-03 · written against
mlcommons/mlperf_client at
version.json = 2.0.0 · announcement:
mlcommons.org ·
signed downloads
MLPerf Client v2.0 is a good release: signed Windows and macOS applications, a CLI as well as a GUI, agentic and image-generation tests, and far broader hardware coverage. Its headline is that you can now generate results on your own machine instead of in a lab.
Those results are performance results — geomean time to first token and 2nd+ token generation rate. This page exists because two questions are left over, and people arrive here asking them:
1 · What did quantization cost in energy? Every LLM configuration shipped in v2.0
runs an already quantized model — Llama-3.1-8B-Instruct-Q4_0.gguf on the llama.cpp CUDA
path, *_ov-int4-* on OpenVINO, *-mlx-q4 on Apple MLX, and nvfp4 /
fp8 / quanto_int8 for image generation. There is no FP16 configuration anywhere in the
suite, which is reasonable — it benchmarks what vendors actually ship — but it means the difference between
quantized and unquantized is not a quantity the suite produces.
2 · What did it cost in quality, in that same run? v2.0 has accuracy harnesses
(tools/accuracy/ifeval, tools/accuracy/mmlu), but they score a model, not a delta
against that model's own FP16 baseline on the same machine in the same session.
Both are exactly what the EcoCompute container measures, in software, on hardware you already own. Neither project replaces the other: MLPerf Client is a benchmark with certified results and a submission process; this is a research protocol with none of that.
Update, 2026-09-03: we ran the missing FP16 baseline, then re-ran it properly
The earlier version of this page said that closing the runtime gap — measuring GGUF F16 against GGUF
Q4_0 inside one runtime, rather than comparing our bitsandbytes numbers to llama.cpp's — was
the next thing on our list. It is done, against the same Llama-3.1-8B-Instruct-Q4_0.gguf that v2.0
itself pulls. The first pass (2026-08-31, n = 3) shipped with a list of known defects and a promise to
redo it; the numbers below are the redo, and the older ones are kept beside them rather than overwritten.
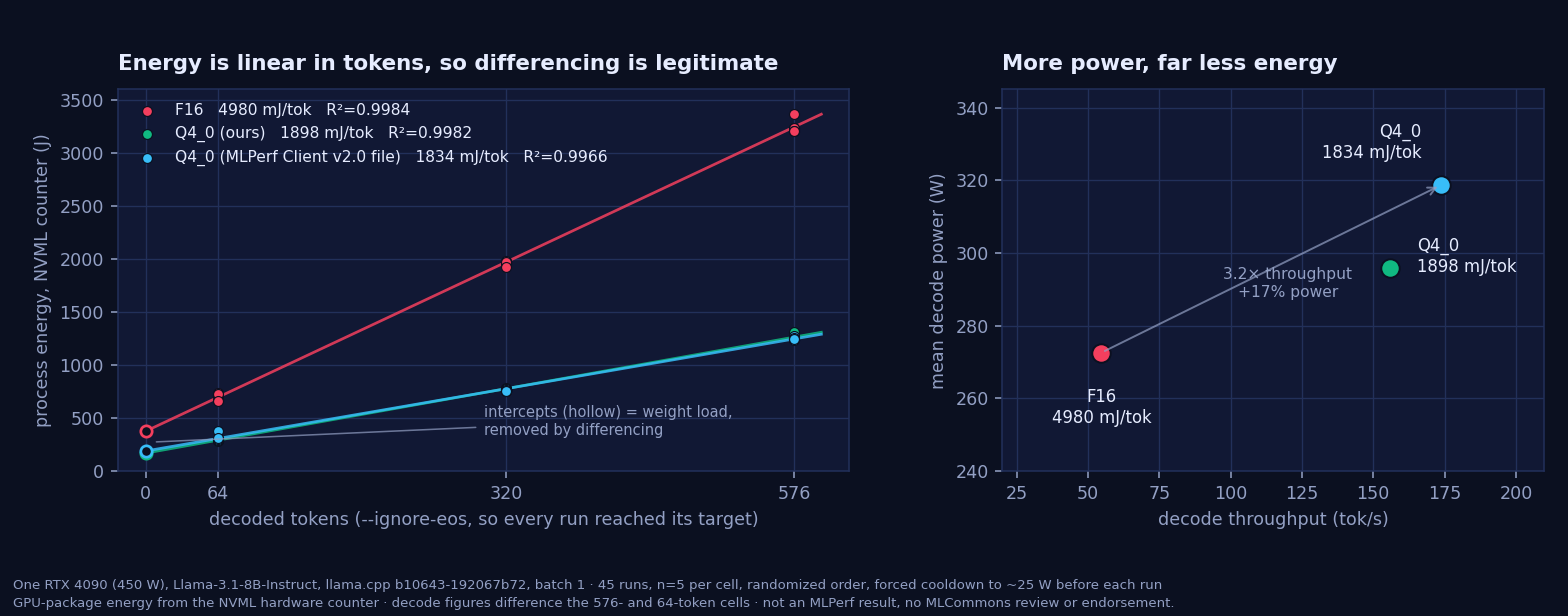
One RTX 4090 at 450 W, one llama.cpp build (b10643-192067b72),
Llama-3.1-8B-Instruct, batch 1, decode-only. 45 runs: 3 arms × 3 token lengths (64/320/576) × n = 5,
randomized order, forced cooldown to ~25 W before every run, NVML hardware energy counter.
| llama.cpp arm | mJ/token | tokens/J | tok/s | decode power | Δenergy | Δperplexity | provisional 2026-08-31 |
|---|---|---|---|---|---|---|---|
F16 | 4980 | 0.201 | 54.7 | 273 W | — | — | 4815 mJ/tok |
Q4_0 (ours) | 1899 | 0.527 | 155.9 | 296 W | −61.9% | +5.60% | 1754 mJ/tok, −63.6% |
Q4_0 (the v2.0 file) | 1834 | 0.545 | 173.8 | 319 W | −63.2% | +5.61% | 1795 mJ/tok, −62.7% |
The saving is not lower power — it is shorter time, and the clean run says so more
sharply than the first one did. Q4_0 decodes at 296–319 W against F16's 273 W: it draws
more power and still costs 62–63% less energy per token, because it emits 2.8–3.2× as many tokens per
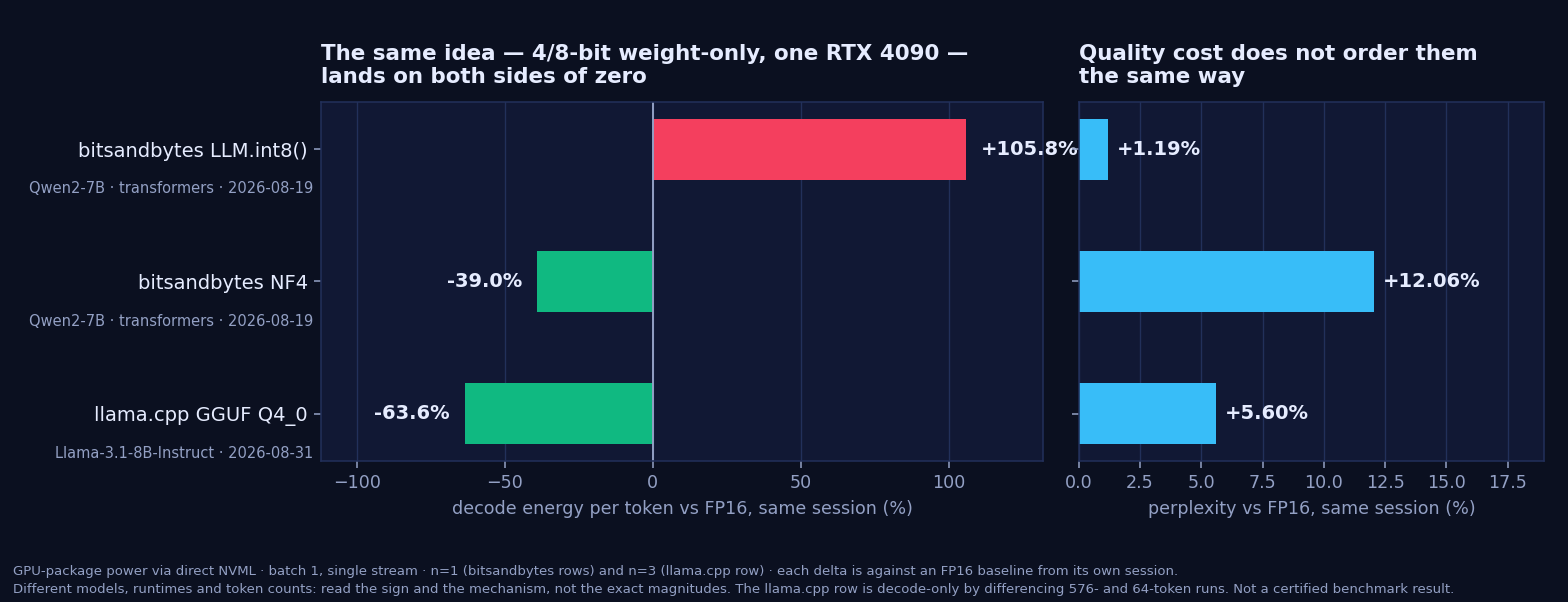
second. On this same card, bitsandbytes LLM.int8() costs 106% more energy per token than its
FP16 baseline. Same idea, opposite sign — which is the point:
it was never the format, it's the kernel.
--ignore-eos plus a zero exit code rather than read back from the runtime;
(2) the NVML energy counter reads 14.9% higher than trapezoidal integration of the same run's 100 Hz
power trace (per run; after differencing, which cancels the constant part, the gap falls to 0.2–4.3%) — the counter
is the reported quantity and both columns are in the CSV;
(3) perplexity was not re-measured — the +5.6% is carried over from the 2026-08-31 session on the
same files and the same build.
Full caveats and the raw rows are in the write-up; the complete
archive — 45 raw run records, scripts, environment snapshot, model hashes — is deposited at
10.5281/zenodo.22295184.
The energy axis of MLPerf Client is real — and it is not available at home
v2.0 does define power measurement, and defines it well:
tools/power/README_MLPerf-client_Power-measurements.md specifies a Yokogawa-class power analyzer, the
SPEC PTDaemon interface, a second "director" machine on the same network, NTP-synchronised clocks, and an EULA you
request by email. tools/power/power_log_parser.py then computes tokens/Joule per prompt
category with a bootstrap 95% CI, pools them, and reports the geometric mean, with warmup iterations excluded.
That is a rigorous, auditable, wall-power number.
It is also a bench setup. The people the signed applications just enabled — someone with one laptop and no analyzer — can produce the tok/s figure and not the tokens/J figure. That gap is the only reason this page exists.
Mapping the two, honestly
| MLPerf Client v2.0 power | EcoCompute | |
|---|---|---|
| Unit | tokens/Joule | mJ/token — the same quantity, tokens/J = 1000 / (mJ/token); the site now prints both |
| Measurement boundary | Wall AC, whole system: CPU, DRAM, display, fans, PSU losses included | GPU package only (nvmlDeviceGetPowerUsage) — a lower bound on system energy, so our tokens/J is an upper bound on a wall-power tokens/J |
| Instrument | Yokogawa analyzer + SPEC PTDaemon + director host | NVML software telemetry @ 10 Hz, integrated over the decode loop |
| Barrier to entry | Hardware, a second machine, an EULA | One command, one machine |
| Precisions covered | Whatever the vendor ships: Q4_0, int4, q4, NVFP4, FP8 | FP16 baseline plus NF4 / INT8 in the same session, which is the whole point |
| Quality | IFEval, MMLU/TinyMMLU as separate harnesses | Teacher-forcing perplexity of the quantized model and its FP16 baseline, same run, fixed corpus |
| Statistics | Bootstrap CI per prompt category, geomean across categories, warmup excluded | Warmup excluded; repeats where we have them (same-machine CV 0.6–3.9%) |
| Status | An official MLCommons benchmark with certified results | An independent research protocol. certified_benchmark_result: false. Not an MLPerf result. |
Running both on the same machine
1 · Speed, from MLPerf Client
mlperf-windows.exe -c NVIDIA_llamacpp-CUDA_GPU.json
2 · Energy and quality, from the container
docker run --rm --gpus all \
  -v "$PWD/out:/workspace/outputs" \
  ghcr.io/hongping-zh/ecocompute-mlcube:latest \
  energy_estimate \
  --model meta-llama/Llama-3.1-8B-Instruct \
  --params_b 8 --precision NF4 \
  --gpu_arch auto \
  --output_dir /workspace/outputs
Why this matters more on a laptop than in a datacentre
Our published curves say the crossover — the model size above which 4-bit weight-only quantization starts to save energy rather than cost it — sits in the low single-digit billions of parameters on the cards we have measured, because at small sizes the throughput loss outweighs the memory-traffic saving. An 8B model on a client GPU sits close enough to that boundary that the sign of the effect is a measurement question, not a theory question. Which is why we would rather have your measurement than our extrapolation.
The first independent replication of this project makes the point: on an RTX 3050 Ti Laptop GPU running TinyLlama-1.1B in NF4, the contributor measured 16.2% less energy per token, where every card we own spends between 4.6% and 33% more at that size. Our own curve had nothing useful to say there — it is fitted on 7–14B data. See the write-up, or the gallery.
A note on what we would like to see upstream
Nothing in the above is a criticism of the power methodology — a PTDaemon-audited wall-power number is strictly
better evidence than software telemetry, and it should stay the standard for submitted results. The gap is that
there is currently no tier below it, so the home user gets nothing. An explicitly informative-only,
non-submittable software-telemetry tier (NVML on Windows and Linux, powermetrics on macOS), labelled
as not comparable to PTD, would let the population v2.0 just enabled see an energy figure at all.
We would bring a warning with that suggestion rather than only enthusiasm. In our own record, repeated runs on one machine agree to within a coefficient of variation of 0.6–3.9%, but the same five INT8 configurations measured on the same card in two different sessions differed by 100 to 140 percentage points — 30 to 50 times the run-to-run noise — and absolute joules per token drifted 12–17% between two consecutive days. The numbers are here. Any at-home energy tier has to be designed around that, which is an argument for reporting deltas against a same-session baseline rather than absolute joules.
Sources
- Announcement — MLPerf Client v2.0, MLCommons blog
- Signed applications — github.com/mlcommons/mlperf_client/releases
- Power methodology —
tools/power/README_MLPerf-client_Power-measurements.mdandtools/power/power_log_parser.pyin that repository - Model configurations quoted above —
data/configs/vendors_default/in that repository - Our protocol — methodology; our data — 10.5281/zenodo.19647290
- The llama.cpp F16 / Q4_0 session quoted above — rtx4090_llamacpp_gguf_v2_2026-09-03.csv (45 runs) and its
.summary.csv; the superseded first pass is rtx4090_llamacpp_gguf_2026-08-31.csv (18 runs); write-up: It was never the format. It's the kernel.; the protocol behind the rerun: Re-running a number we didn't trust - The same correction, posted upstream — mlcommons/mlperf_client#19
- Archived raw data for that session — 10.5281/zenodo.22295184 (CC BY 4.0)