Evidence — everything we have measured, at its replication level
This is the layer where every measured claim on quantenergy.tech lives: the coverage matrix, the anchors behind the fitted curves, the deep dives and re-tests, public replications, and the datasets they are archived in. Nothing here is an estimate; the estimator is a separate, labelled tool. What each count means — 26/56, 29, 42, 144, 360+ — is defined once in the number glossary.
Latest · 2026-09-25 · RTX 4090 NF4 re-tested across two physical cards
Same cell, two stacks. The gray trajectory is the July session on one card (one session per point); the blue cluster is the 3B cell only, re-measured on the current stack. Only 3B was re-measured — the rest of the July line is not re-tested, and the pooled fitted Ada curve (crossover ≈3.7B, which also carries 4090D anchors) is a different object from either. Trial dots are offset horizontally for visibility; B and C differ by 0.2 pp and nearly coincide at this scale.
1 · July's +0.8% anchor is confirmed — across two cards, three sessions and a whole stack generation, Ada at 3B is break-even to a small NF4 penalty. 2 · The −15.1% historical reading was not reproduced — none of the three current-stack sessions lands within 15 points of it. Its software stack and conditions differ from the present run and no specific error was identified, so it is retained as a divergent historical observation and excluded from current-stack conclusions. 3 · No direction flip at the 3B anchor — the same stack that moved the 5090 crossover by 3B left this card at break-even. Only the 3B anchor was re-measured; whether the full Ada crossover curve moves under this stack awaits the 1.5B and 7B points. 4 · Card and session gaps, described — not decomposed: the two cards' observations differ by ≈ 2.8 points; the two sessions on card 2 differ by ≈ 0.2 points. Card 1 was measured only once, so this is not a formal variance decomposition — and for card-population questions the physical sample is ncard = 2. It still motivates the v1.0 bar's multiple-cards-per-architecture requirement. The two cards' FP16 baselines agree to <0.1% (3426 vs 3423 mJ/tok), and the perplexity probe reproduces to three decimals across all three sessions (5.8004 vs 4.5473) — same code path, so the residual differences are energy, not software.
Archived separately as
data/rtx4090_bnb_2026-09-25.csv
(+ per-card summary, generator script with consistency guards, raw schema-1.3 reports with 10 Hz whole-run
power-trace sidecars). Not pooled into the seed counts or the fitted curves: the stack differs from the
published pins (bitsandbytes 0.50.2 ≠ 0.43.3), so vs_fp16 is not directly comparable with image runs. Trace
re-integration agrees with the reported counter energies to <0.15% on all six arms.
Coverage matrix · what has been measured, and what nobody has measured yet
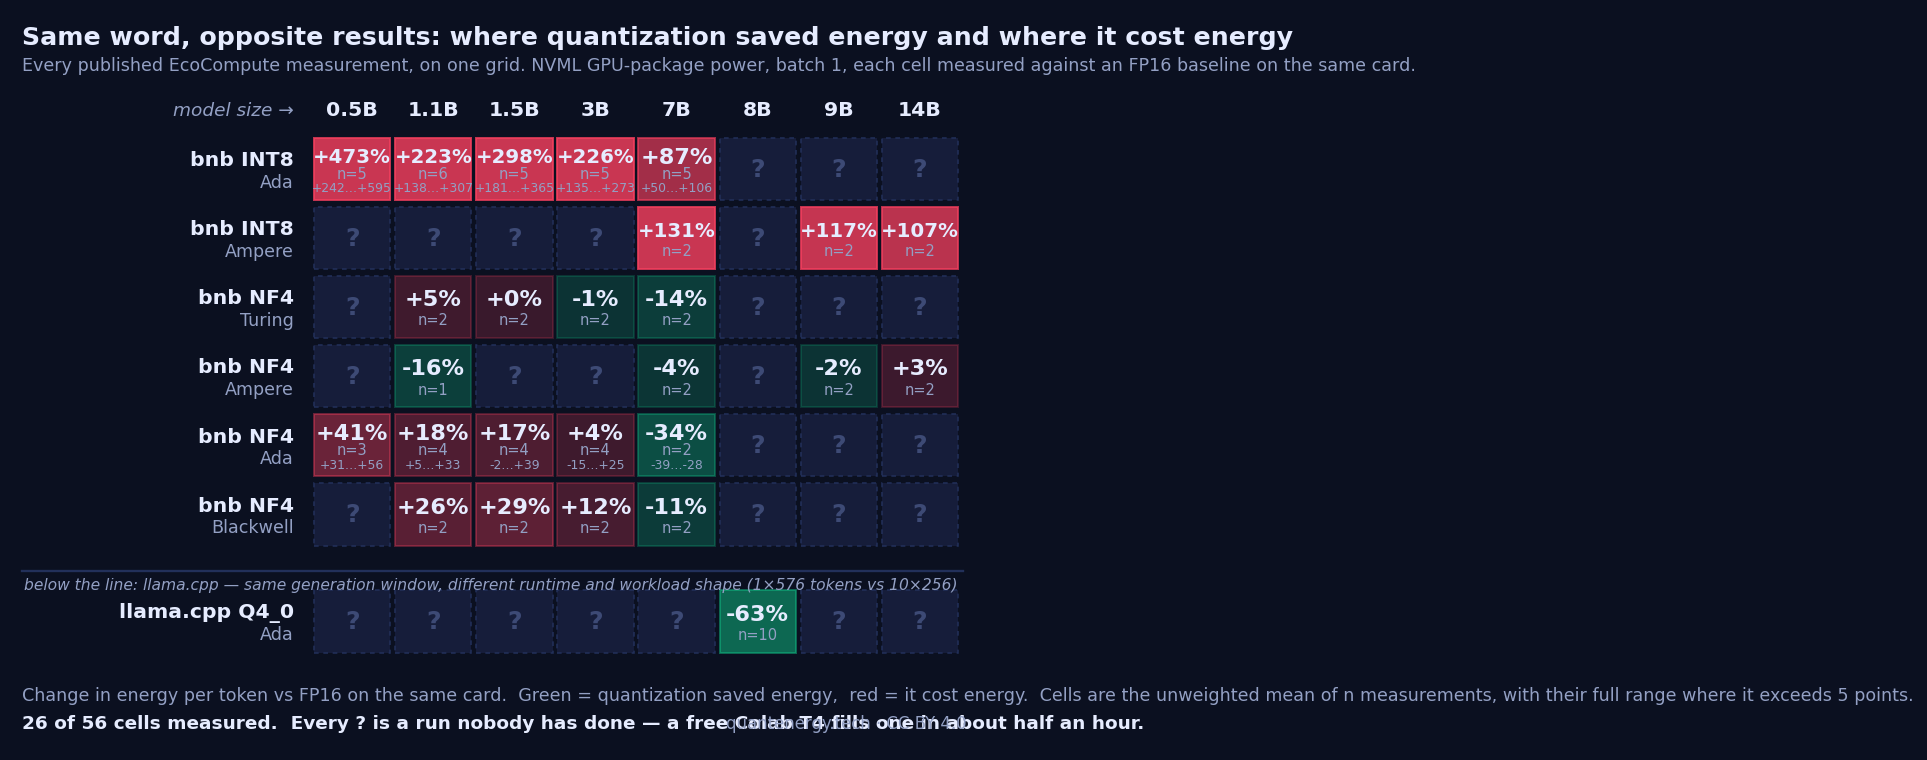
Three things the grid says that no single number does.
1 · bitsandbytes LLM.int8() never saved energy — eight measured cells, 0.5B to 14B,
Ada and Ampere, every one a penalty (+87% … +473%). It lowers instantaneous power and loses more than that
to collapsed decode throughput.
2 · NF4 changes sign with model size, and the size at which it flips moves with the architecture —
fitted crossings sit near 2.1B on Turing, 3.7B on Ada and 4.8B on Blackwell.
"Does NF4 save energy?" has no answer that is not conditional on the card.
3 · The largest effect in the whole grid sits in the emptiest row — llama.cpp GGUF Q4_0
is −63% at 8B, and it is the only cell in that row. One point is not a trend; that row is a claim
waiting to be checked, including by anyone who wants to contradict it.
Read it with the same care as the rest of the site. Cells are the unweighted mean of the runs behind
them and most are n = 1 or 2, so the printed range matters more than the mean where one is shown.
Every cell is on the generation window — model load, quantization and warm-up excluded: the
bitsandbytes rows always were (the container starts sampling after warm-up; this grid once mislabelled them
whole-process), and the llama.cpp row is re-cut from its archived 100 Hz power traces
(window comparison).
The llama.cpp row stays below a rule because it is a different runtime and workload shape —
one 576-token generation per run against the container's 10×256 tokens — same window, still not one benchmark.
All of it is GPU-package power, not wall AC, and none of it is a certified benchmark result.
The grid is generated from the published CSVs by
build/make_coverage_matrix.py
— if you think a cell is wrong, the input files are in the repo.
RTX 4090 (Ada) deep dive · measured in our own open container · July 2026
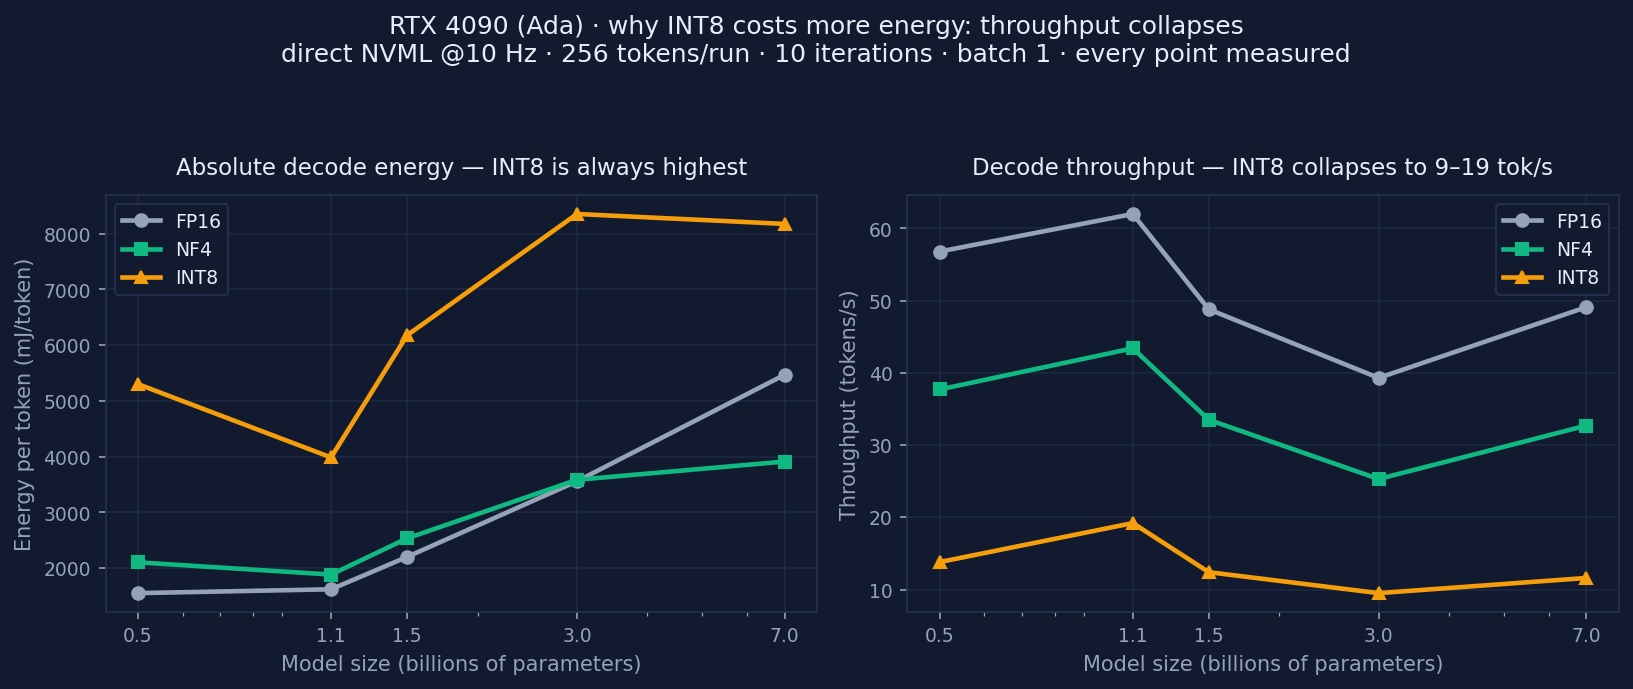
NF4 reaches break-even just above 3B on this card: +36% energy penalty at 0.5B → +0.8% at 3B → −28% saving at 7B — the 3B value now re-tested at n = 3 across two cards, mean +1.6%. These points are folded into the fitted Ada curve, which puts the crossover at ≈3.7B — later than this card alone, because the fit also carries the more heavily penalised RTX 4090D anchors. INT8 (bitsandbytes LLM.int8()) did not save energy at any size we tested (+50% … +242%, five sizes, one card, n = 1 each): it does lower instantaneous power, but decode throughput collapses to 9–19 tok/s (FP16: 39–62 tok/s), so a token ends up costing more. That is a statement about this backend on this card, not about INT8 in general — a different kernel, card or serving stack could well reverse it.
INT8 energy penalty by model size · vs FP16 on the same card
Every bar here points the wrong way: no model size we tested saved energy in INT8 on this card, and the penalty does not fall monotonically with size (1.5B is worse than 1.1B). The penalty does shrink towards 7B, but we have no measurement above it, so we do not claim INT8 breaks even at some larger size — on this card INT8 bought memory, not energy. Bars are hatched because these are single trials (n = 1) on one RTX 4090. The 1.1B bar has since been re-measured on a second RTX 4090 instance (August 2026, same container): +138% against the July run's +146% — two single trials 8 points apart, on different software versions. Both are in measured.csv as separate n = 1 anchors; neither is a replication of the other. Also note: the fitted INT8 curves cover Ada and Ampere only, H100 borrows the Ampere curve (estimated, not measured), and T4 and RTX 5090 have none. RTX 5090 INT8 has since been measured — ten runs, all positive, +55% to +259% — in the 2026-09-20 session below, which is a different software stack and is deliberately not folded into these fits.
Honest scope · what this run does and does not support
| ✅ Do | ⚠️ Don't |
|---|---|
| Treat each value as a real measurement of this RTX 4090 under this workload (256 tokens, batch 1, single stream) | Read n = 1 as a tight distribution: every configuration was run once (ten decode iterations integrated into one energy total), so there is no std and no CV — unlike the main dataset's n = 2 / CV < 2% |
| Compare precisions on the same card — that is what ΔE% is | Compare cards across these two layers without noting that one is replicated and one is not (hollow markers and hatched bars mark n = 1 site-wide) |
| Use the numbers as GPU-package energy from direct NVML sampling | Present them as whole-system, datacenter or carbon numbers — there is no PUE, no CPU/DRAM and no grid model here |
| Cite it as a supplementary single-platform case study (DOI) alongside v1.1.0 | Cite it as a certified MLPerf/MLCommons result, or as a replacement for the main dataset |
| Reproduce or contradict it — one card, one hour: run the container and publish your point | Assume our card generalises to yours: cooling, driver, power limit and BIOS all move absolute energy |
All raw energy.json reports, the aggregated CSV, environment metadata and both figures are archived
under DOI 10.5281/zenodo.22037483,
CC BY 4.0 — a single-platform deep dive that sits alongside the main
v1.1.0 dataset, which remains
the reference for every other GPU here. Honest scope: n = 1 per configuration
(no std/CV yet, unlike v1.1.0's n = 2 / CV < 2%) and NVML measures GPU-package power,
not whole-system wall power — a supplementary case study, not a certified benchmark.
2026-09-20 · The RTX 5090 crossover moved, and the card didn't
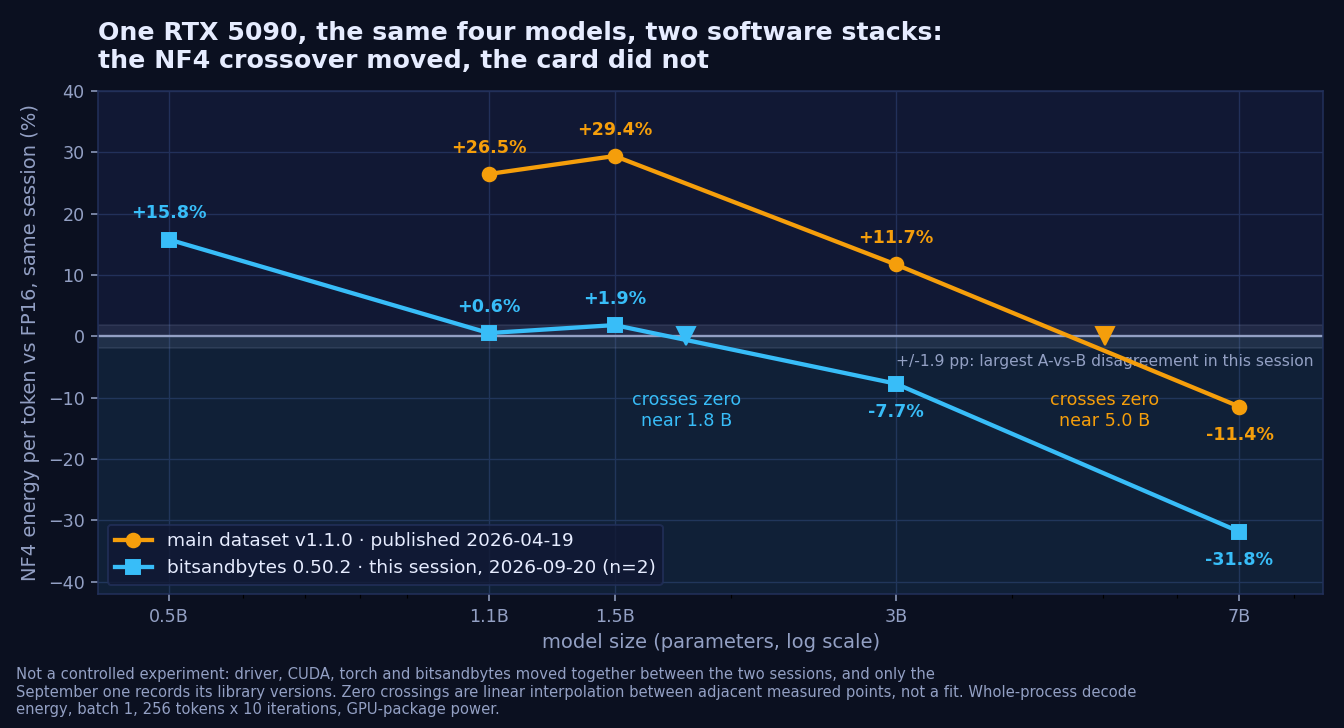
Five models, 0.5B–7B, NF4 and INT8 against a per-session FP16 baseline, batch 1, 256 tokens × 10 iterations, NVML at 10 Hz — run twice with a full instance restart in between, so every cell is n = 2 across restarts. The two sessions agree to 2.1 points on average and 5.2 at worst; that spread is the shaded band, and it is why +0.6% and +1.9% at 1.1–1.5B read as "indistinguishable from FP16" rather than as real numbers. This is not a controlled experiment: driver, CUDA, torch and bitsandbytes all moved between the two curves and only the September session records its library versions, so the claim is that the crossover shifted with the stack — not that one library release caused it. INT8 remains positive at every size on the newest consumer architecture with a current bitsandbytes (+55% at 7B, +256% at 0.5B), for the same reason as everywhere else here: 14–32 tok/s against NF4's 49–79, at lower package power.
FP8 on Blackwell · two code paths, both more expensive
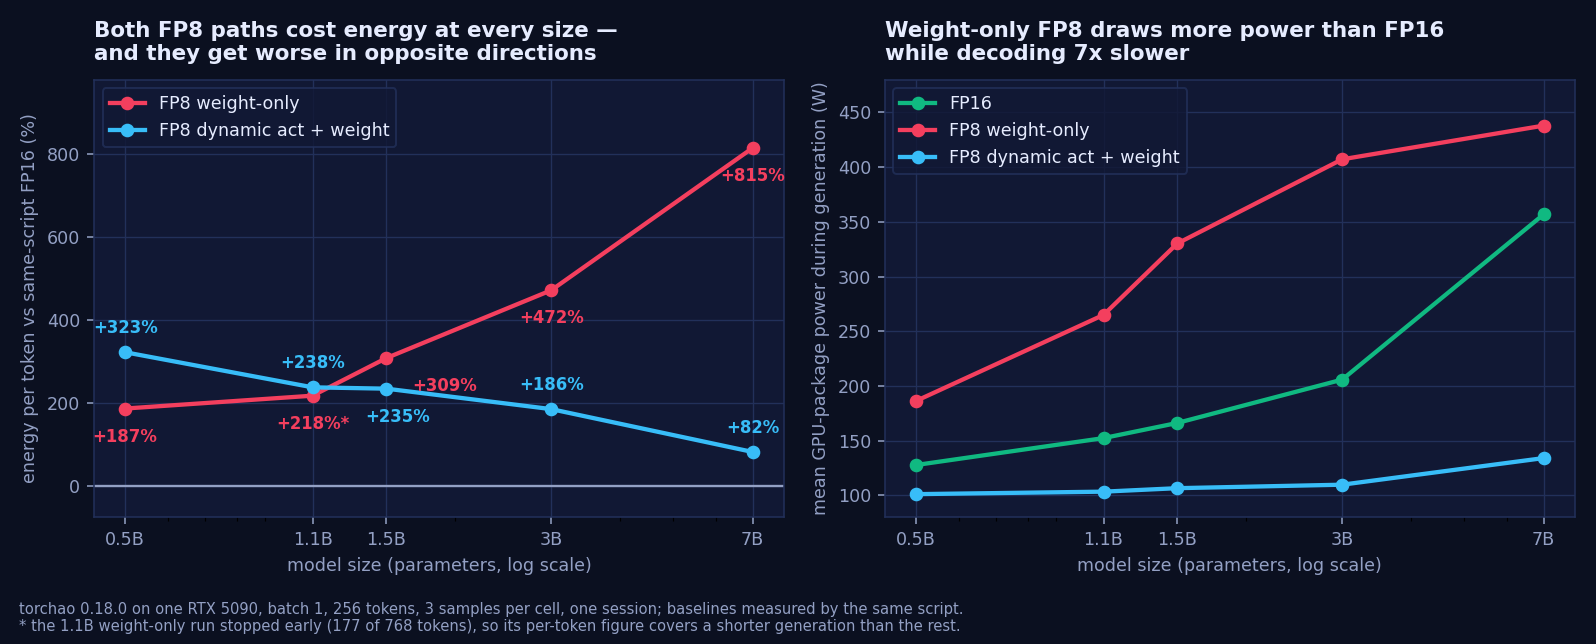
Blackwell has FP8 tensor cores, and neither torchao FP8 path saved energy at any size we measured. They fail in opposite directions: weight-only degrades with scale (+187% → +815%) while dynamic activation+weight improves with it (+323% → +82%), which is what you expect from dequantization overhead that scales with weights versus a fixed per-activation cost. Weight-only also draws more power than FP16 at every size while decoding up to 7× slower. This is a statement about these kernels at batch 1 — the regime FP8 is least suited to — and a separate script from the container above, with its own baselines: do not compare these percentages against the NF4/INT8 numbers, whose measurement window is wider. The 1.1B weight-only cell stopped after 177 of 768 tokens and is asterisked for that reason.
Per-run CSVs, the A-vs-B agreement table and both build scripts are in
data/
(rtx5090_bnb_2026-09-20.csv, rtx5090_fp8_torchao_2026-09-20.csv); raw
energy.json reports, the environment snapshot and the FP8 script are archived at
DOI 10.5281/zenodo.22855133,
CC BY 4.0. Four reports in that archive named a TinyLlama repo id that does not resolve; the container
labelled them basis: interpolated and they are excluded here — published so the failure is
auditable, not counted as measurements.
These rows are a supplementary session, not folded into the fitted curves, which still describe the
0.4x-era stack; pooling the two would produce a crossover neither session measured. Not an MLPerf result.
2026-09-03 · The kernel decides the sign, not the bit width
Environment · the stacks behind these numbers, as plain text
Where the numbers live · datasets and archives
| Archive | What it holds | Replication |
|---|---|---|
| Main dataset v1.1.0 | 360+ measured configurations, 0.5B–14B, four architectures, FP16/NF4/INT8/FP8 — the source of the seed counts and the fitted curves | n = 2, CV < 2% |
| RTX 4090 deep dive | July 2026 energy (15 configs), August paired energy+perplexity, August INT8 repeats, community submission | n = 1 per config; INT8 repeats n = 3 |
| RTX 5090 re-test | 2026-09-20 session: 22 runs on the current stack, raw reports + environment + FP8 script | n = 2 across restart; separate archive, not pooled |
| RTX 4090 NF4 two-card re-test | 2026-09-25: 3 sessions × 2 physical cards, schema-1.3 reports with whole-run power-trace sidecars (window re-cuttable) | n = 3 across 2 cards; separate archive, not pooled |
| llama.cpp kernel study | 45 runs, Q4_0 vs F16 on one RTX 4090 — the kernel-decides-the-sign finding | n = 5, randomized order |
Every archive is CC BY 4.0. Supplementary sessions are versioned separately and never silently pooled — see the changelog for what entered what, and when.