Re-running a number we didn't trust: 89% of the session was cooldown
A week ago we published an energy measurement and said, in the same note and in the upstream feature request that quoted it, that the headline was probably an overestimate. Three things were wrong with the session: n = 3, the runs went in a fixed order with no cooldown between them, and we never checked how many tokens each run actually generated. That last one had a visible symptom — the F16 arm implied it was reading memory at 101% of the card's physical bandwidth, which is impossible, and the obvious explanation was that it hit an end-of-sequence token and stopped early.
Saying a number is provisional is cheap. This note is the rerun, and it is written for the person who wants to measure inference energy at home rather than for the person who wants the answer: what the four fixes cost, and which ones mattered. The original note carries the corrected figures and the argument they support; here we are only interested in the protocol.
--ignore-eos, and the NVML hardware energy counter instead of an integrated power
trace. The headline moved from −63.6% to −61.9%, so the suspected overestimate was real
and small. One conclusion inverted: the quantized arms draw more power than F16, not the same.
The whole thing cost 50 minutes of one rented RTX 4090, of which 5.4 minutes was compute.
Fix 1 · Cooldown, which is 89% of the bill
In the first session the runs went back to back. Sixteen of the eighteen therefore started on a GPU that was still 145–248 W warm from its predecessor, and — this is the part that should worry anyone comparing arms — the only two runs that started genuinely cold were the two largest outliers. Thermal history was correlated with position in the run order, and position in the run order was correlated with the arm.
The rerun waits before every single run until the card is back at idle, and records the state it started from. All 45 cooldowns converged; each run began between 24.2 and 27.8 W and 27–30 °C, with peak temperatures of 39–46 °C during decode. The GPU is now in the same state at the start of every measurement, which is the entire point.
What it costs is time, and the ratio is worth internalising before you plan a session:
| Where the 50 minutes went | minutes | share |
|---|---|---|
Actual inference (45 runs of llama-cli) | 5.4 | 11% |
| Waiting for the card to cool down | 45.1 | 89% |
So an energy session is nine parts waiting to one part measuring. Budget for it — and if you are renting by the hour, notice that a protocol you can defend costs about ten times the GPU-time of one you cannot, and that this is still small money. Randomizing the run order (fixed seed, so the sequence is reproducible) costs nothing at all and removes what cooldown cannot: any leftover correlation between arm and position.
Fix 2 · --ignore-eos, the one that actually moved the number
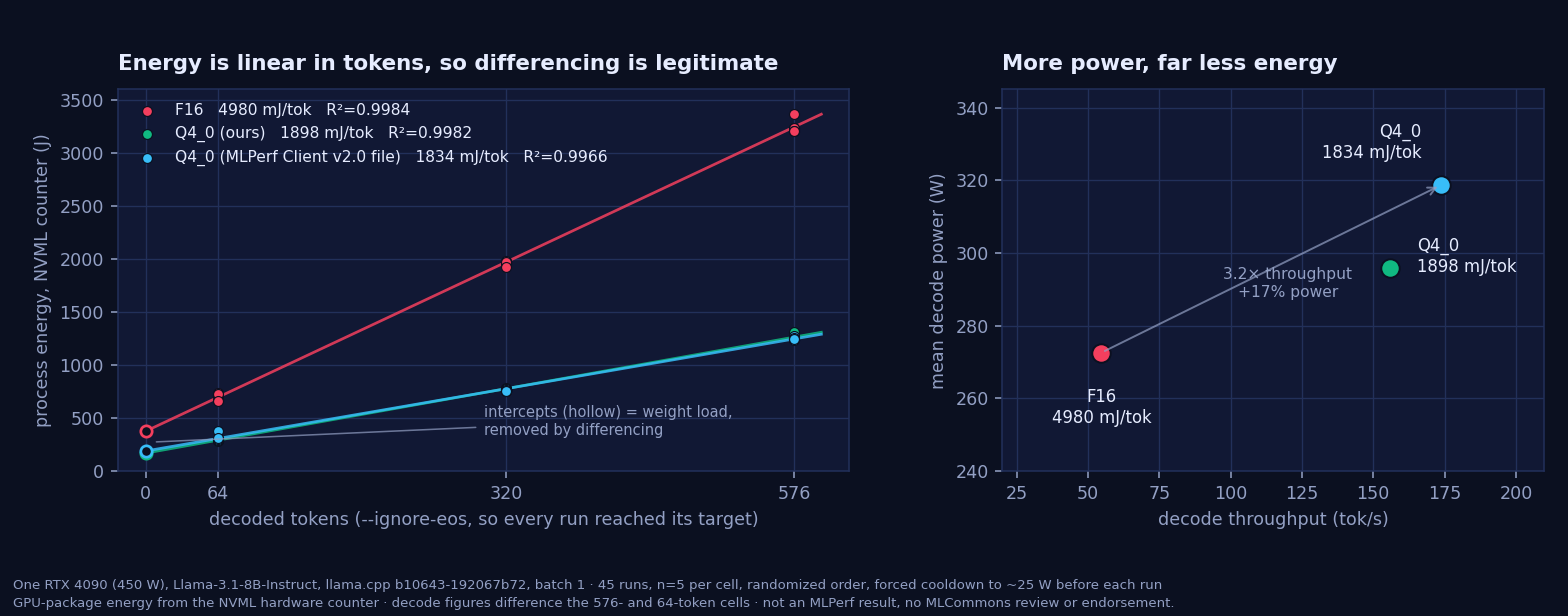
If a run stops early on an end-of-sequence token, its energy is divided by a token count you assumed rather than the one it produced, and the arm that stops earliest looks worst. Forcing decode to the full requested length removes the failure mode entirely. F16 now lands at 54.7 tok/s and a believable fraction of the card's bandwidth, and the ratio it anchors dropped by 1.7 points.
What we still did not get is the token count read back from the runtime. llama.cpp prints a
timing line with the real n_eval; our wrapper's regex did not match it, so a run is
credited with the tokens it was asked for whenever --ignore-eos was set and the process
exited 0. Given the flag that is a sound inference, and it is what removed the impossible-bandwidth
artifact — but it is an inference, and the CSV and the write-ups all say inferred rather than
captured. It is the top item for the next session.
Fix 3 · A third token length, so differencing stops being an assumption
Every energy-per-token figure on this site is a difference: run the same model at two output lengths
and subtract, so that loading 16 GB of F16 weights against 4.7 GB of Q4_0 weights
cancels instead of handing the quantized arm a free head start. That subtraction is only exact if
process energy is affine in the token count. With two lengths you cannot check it — two points always
fit a line.
Adding a 320-token cell makes it testable. Fitting E = a + b·n across all 15 runs of each
arm gives R² ≥ 0.9966, a slope that matches the differenced value to the digits we print,
and an intercept of 171–378 J sitting exactly where the weight load should be. This is the cheapest
of the four fixes — one extra cell per arm — and the one that converts a methodological objection into a
plotted line.
Fix 4 · The hardware counter, which disagrees with the power trace by 15%
The first session integrated a 10 Hz power trace. The rerun reads NVML's hardware energy accumulator, which integrates inside the GPU, and keeps a 100 Hz trace alongside it purely as a cross-check. They disagree, and by more than we expected: across the 45 runs the counter reads 14.9% higher on average than trapezoidal integration of the same run's trace, with a per-run range of 2.5–31.8%.
That gap is the most useful thing in the dataset for anyone designing an at-home energy tier, so it is published rather than tidied away. Two readings of it, and both are worth holding:
- Sampled telemetry is not the same instrument as a counter. A 100 Hz trace misses what happens between samples, and on a bursty decode loop that is not a rounding error.
- The headline survives it anyway. After differencing — which cancels whatever is common to the 576- and 64-token runs of the same arm — the two accountings agree to 0.2–4.3%. Both columns are in the per-run CSV so you can redo the arithmetic the other way.
This is also, incidentally, the argument for what we asked MLPerf Client for: an informative-only software-telemetry tier that never enters the submission path. A number this soft has no business being compared across vendors. It has every business being visible to the person running the benchmark on their own machine.
What the rerun did not fix
- Perplexity was not re-measured. The +5.6% quality cost is carried over from the first session,
on the same three files and the same build. It is a property of the weights rather than of the run
protocol, but it has not been repeated under the clean protocol and the CSV says so in a
perplexity_sessioncolumn. - Still GPU-package power, from software telemetry, on one card, in one session, at batch 1. Not wall AC, no CPU, DRAM or PSU, no PUE, no CO₂e.
- Still not an MLPerf result, and carrying no MLCommons review or endorsement. It uses a model file MLPerf Client v2.0 distributes; that is the whole of the relationship.
- n = 5 is not a large sample. The within-cell SD is 1.3–1.8% of the differenced value, which is fine against a 62% effect and useless for the third digit.
Everything is published
All 45 raw run records, the measurement scripts, the environment snapshot and the model SHA-256 hashes are archived at 10.5281/zenodo.22295184 (CC BY 4.0). The per-run and aggregate CSVs are in this site's repository, regenerable with one command:
python3 build/make_llamacpp_v2_csv.py <archive_dir> data
The superseded 18-run session stays published beside them. That is the only thing that makes "we think this is an overestimate" a statement with any weight: the first pass has to remain downloadable after the correction lands, so anyone can check what moved and by how much.