Scope of every number here: GPU-package power (NVML), not whole-system draw — no PSU losses, CPU, DRAM, cooling, PUE or CO₂e. Single-stream decode, batch 1, 256 tokens. Replication is stated per point: the main dataset is n = 2 (CV < 2%), the RTX 4090 deep dive is n = 1 per configuration. Limits and how to disprove us →
Open measurement stack: an MLCube-compatible container doing direct NVML power sampling, the datasets it produced (Zenodo, CC BY 4.0), and the preprint that interprets them.
Hardware, software versions, DOIs and the command — as plain text, so Ctrl+F finds them.
The stacks below are not identical to each other, and saying so is the point. The published
Ada curves were measured in the 2026-07-24 session; the container image you would pull today pins a
different torch; and a native (non-Docker) install pins a third one, on which the same INT8 configurations
measured about twice the energy penalty. Which of these you run changes the INT8 number you get.
Run-to-run vs cross-session, with the CVs →
Hardware · 硬件
NVIDIA GeForce RTX 4090 · Ada Lovelace · 24 GB · compute capability 8.9 · CUDA build
12.1 · NVIDIA driver 535.146.02 in the August sessions (the July driver is in
run_metadata/gpu_summary.csv of that session's raw archive). Rented AutoDL instances.
Other anchors in the fit: RTX 4090D (Ada), RTX 5090 (Blackwell), A800 (Ampere), T4 (Turing).
Power: NVMLnvmlDeviceGetPowerUsage at 10 Hz, integrated over the decode loop —
GPU-package power only, not wall power.
Software · 软件
Container image (what you get today): Python 3.10 · torch 2.13.0 ·
transformers 4.57.6 · bitsandbytes 0.43.3 · accelerate 1.14.0 ·
nvidia-ml-py 13.610.43, base nvidia/cuda:12.1.1-cudnn8-runtime-ubuntu22.04
(requirements.lock.txt). 2026-07-24 session — the anchors the Ada curves are fitted on: Python 3.8 ·
torch 2.4.1+cu121 · transformers 4.46.3 · bitsandbytes 0.45.5 ·
accelerate 1.0.1. Older than the current pins. 2026-08-19 / 08-20 native sessions: Python 3.10.20 · torch 2.5.1+cu121, the other four
matching the pins above.
Data · 数据
Main dataset v1.1.0 — DOI 10.5281/zenodo.19647290, n = 2 per configuration, CV < 2%. RTX 4090 deep dive — DOI 10.5281/zenodo.22037483
(concept 10.5281/zenodo.22019741): 2026-07-24 energy, n = 1; 2026-08-19 energy + same-run perplexity, n = 1;
2026-08-20 INT8 n = 3 per size, CV of ΔE% 0.6–3.9%. Protocol: batch size 1 · context 2048 · 256 generated tokens per run · 10 decode iterations after 2
warmups · greedy · each model's own FP16 baseline in the same session.
Quality probe corpus SHA-256 22ac091a6383740d30f8e41ae144032c873c772db5e1c901112c1c330fdc5504.
Container · 容器
Image ghcr.io/hongping-zh/ecocompute-mlcube:latest, rebuilt by CI on every merge to
main. One INT8 run of TinyLlama-1.1B:
docker run --rm --gpus all -v "$PWD/out:/workspace/outputs" ghcr.io/hongping-zh/ecocompute-mlcube:latest energy_estimate --model TinyLlama/TinyLlama-1.1B-Chat-v1.0 --params_b 1.1 --precision INT8 --gpu_arch auto --output_dir /workspace/outputs
Writes out/energy.json, schema ecocompute-energy/1.1, carrying
results.vs_fp16_energy_pct, results.basis and the software block that
recorded the versions above. Drop it into /replications/ to overlay it on the curve.
Inference energy per 1M tokens
Paste the verdict + citation into your tech spec, or share this exact config.
Crossover curve · in what we measured, the bigger the model, the more quantization saves
NF4INT8Your modelFilled = n ≥ 2 repeated trialsHollow = n = 1 single trialAbove zero = penalty (more energy) · below = savings
Solid lines connect measured points only (direct NVML). Marker fill encodes replication, not accuracy: filled dots are points repeated at least twice in the main dataset (v1.1.0, n = 2, CV < 2%); hollow dots on a faded line were measured once (n = 1) — the July 2026 RTX 4090 deep dive and one early RTX 4090D point — so they carry no measured spread and should be read as a single observation, not as a distribution. INT8 was measured on A800 and RTX 4090 only, and sizes outside each GPU's measured range aren't drawn here. For fitted extrapolation beyond the measured range, use the Your model tab.
Where these numbers come from · the open measurement container
EcoCompute is not a table of numbers you have to trust — it is a measurement container you can run.
The EcoCompute energy MLCube
samples GPU power directly through NVML during real decoding and writes an energy.json whose fields are
exactly the ones plotted here, so an independent run either lands on our curve or visibly does not.
Direct measurement, never TDP
NVML on-device power sampling at 10 Hz over the decode phase, 256 tokens per run with warmup, repeated for the configured iterations. Energy, average power and throughput come out of that trace — no datasheet wattage, no wall-meter guesswork.
It refuses to fake a measurement
No GPU, or NVML power telemetry unavailable? The run still completes, but the report is derived from the published dataset and labelled basis ≠ measured with the fallback named in measurement_source. A fallback is never dressed up as a measurement.
Portable and contract-checked
An MLCube-compatible descriptor with one task, energy_estimate, exercised with the official mlcube CLI on the Docker platform; a CPU descriptor verifies the build/mount/report contract without a GPU. Dependencies are pinned with a full transitive lock, because bitsandbytes and torch change NF4/INT8 kernels between releases.
Machine-checkable output
Every report validates against schema/energy.schema.json and carries its own scope: certified_benchmark_result: false, plus a scenario_note saying the SingleStream/Offline label is nominal and not enforced by LoadGen.
New · 2026-09-03 · The kernel decides the sign, not the bit width
MLPerf Client v2.0
ships an already-quantized suite, so it cannot tell you what quantizing cost. We measured the missing baseline
inside one runtime: on an RTX 4090, llama.cpp GGUF Q4_0 decoding Llama-3.1-8B-Instruct costs
61.9% less energy per token than GGUF F16, for +5.60% perplexity. The quantized arms
draw more power while decoding — 296–319 W against F16's 273 W — and win purely on throughput (2.8–3.2×).
On the same card, bitsandbytes LLM.int8() costs 106% more. Same idea, opposite sign.
Corrected 2026-09-03: re-run over 45 runs, n = 5, randomized order, cooldown before every run,
hardware energy counter; the provisional −63.6% was indeed an overestimate. One card, decode-only by differencing,
GPU-package power. Not an MLPerf result. Raw data:
10.5281/zenodo.22295184.
Latest run · RTX 4090 (Ada) · measured in our own open container
15 of the 15 configurations in this one session are real hardware measurements (basis: "measured", measurement_source: "direct-nvml")
— five models (0.5B–7B) × FP16 / NF4 / INT8 on this single card, not a site-wide total; the site as a whole rests on
29 measured anchors across five cards. Produced by the
EcoCompute energy MLCube
container on a rented NVIDIA GeForce RTX 4090, July 2026. It extends the Ada data in two ways the earlier
RTX 4090D anchor could not: INT8 on Ada and 7B models.
NF4 reaches break-even just above 3B on this card: +36% energy penalty at 0.5B → +0.8% at 3B → −28% saving at 7B.
These points are now folded into the fitted Ada curve, which puts the crossover at ≈3.7B — later than this card alone,
because the fit also carries the more heavily penalised RTX 4090D anchors.
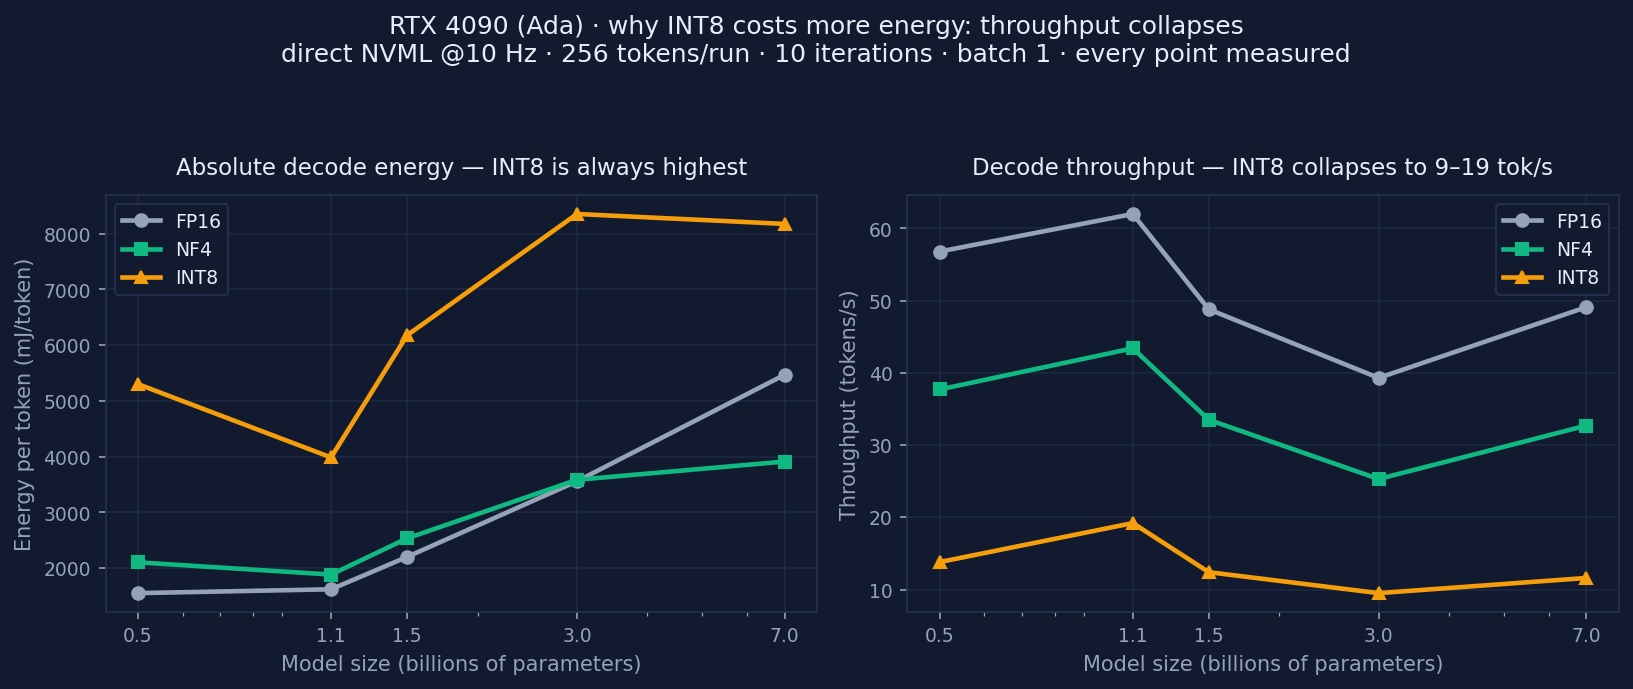
INT8 (bitsandbytes LLM.int8()) did not save energy at any size we tested (+50% … +242%, five sizes, one card,
n = 1 each): it does lower instantaneous power, but decode throughput collapses to 9–19 tok/s
(FP16: 39–62 tok/s), so a token ends up costing more. That is a statement about this backend on this card,
not about INT8 in general — a different kernel, card or serving stack could well reverse it.
INT8 energy penalty by model size · vs FP16 on the same card
One RTX 4090 · bitsandbytes LLM.int8() · batch 1, 256 tokens · n = 1 per bar (no error bar exists to draw) · GPU-package power.
+242%0.5B
+146%1.1B
+181%1.5B
+135%3B
+50%7B
Every bar here points the wrong way: no model size we tested saved energy in INT8 on this card, and the penalty does not
fall monotonically with size (1.5B is worse than 1.1B). The penalty does shrink towards 7B, but we have no
measurement above it, so we do not claim INT8 breaks even at some larger size — on this card INT8 bought
memory, not energy. Bars are hatched because these are single trials (n = 1) on one RTX 4090.
The 1.1B bar has since been re-measured on a second RTX 4090 instance (August 2026, same container):
+138% against the July run's +146% — two single trials 8 points apart, on different software
versions. Both are in measured.csv as separate n = 1 anchors; neither is a replication of the other.
Also note:
INT8 was measured on Ada and Ampere only, H100 borrows the Ampere curve (estimated, not measured), and T4 and
RTX 5090 have no INT8 curve at all.
Honest scope · what this run does and does not support
✅ Do
⚠️ Don't
Treat each value as a real measurement of this RTX 4090 under this workload (256 tokens, batch 1, single stream)
Read n = 1 as a tight distribution: every configuration was run once (ten decode iterations integrated into one energy total), so there is no std and no CV — unlike the main dataset's n = 2 / CV < 2%
Compare precisions on the same card — that is what ΔE% is
Compare cards across these two layers without noting that one is replicated and one is not (hollow markers and hatched bars mark n = 1 site-wide)
Use the numbers as GPU-package energy from direct NVML sampling
Present them as whole-system, datacenter or carbon numbers — there is no PUE, no CPU/DRAM and no grid model here
Cite it as a supplementary single-platform case study (DOI) alongside v1.1.0
Cite it as a certified MLPerf/MLCommons result, or as a replacement for the main dataset
Assume our card generalises to yours: cooling, driver, power limit and BIOS all move absolute energy
All raw energy.json reports, the aggregated CSV, environment metadata and both figures are archived
under DOI 10.5281/zenodo.22037483,
CC BY 4.0 — a single-platform deep dive that sits alongside the main
v1.1.0 dataset, which remains
the reference for every other GPU here. Honest scope: n = 1 per configuration
(no std/CV yet, unlike v1.1.0's n = 2 / CV < 2%) and NVML measures GPU-package power,
not whole-system wall power — a supplementary case study, not a certified benchmark. Reproduce it on your own card
from the Run it yourself tab.
Public replications · don't take our word for it
A single-maintainer dataset is only as strong as its first independent confirmation — or contradiction.
Run the container on your card, then publish your point in the open gallery: your energy.json is
parsed in your browser, and submitting copies the write-up to your clipboard and opens a GitHub issue you
paste into and read before you send it.
Disagreements are published exactly as prominently as confirmations.
EcoCompute is not a competitor to the established energy benchmarks — it answers a narrower question they do not:
for one model on one GPU, does switching FP16 → NF4/INT8 raise or lower energy per token?
That needs a controlled A/B of precisions on identical hardware, which is why we sample GPU-package power directly
instead of ranking systems or estimating carbon.
Audited whole-system wall power of submitted MLPerf Inference/Training runs, under LoadGen timing rules, with certified results
We report GPU-package power only and run our own warmup/iteration loop, so our numbers are a supplementary energy methodology — explicitly certified_benchmark_result: false, never an MLPerf result
Client-machine performance (geomean TTFT and 2nd+ token rate) of the models vendors ship — all of them already quantized (Q4_0, int4, MLX q4, NVFP4/FP8). Its tokens/Joule path is wall power via a Yokogawa analyzer, SPEC PTDaemon and a second host
We measure the FP16 baseline alongside the quantized model in the same session, in software, on one machine — so the difference quantization made is a number rather than an inference. Different boundary (GPU package, not wall) and not a certified result: how the two map onto each other →
Ranks whole supercomputers by GFLOPS/watt on HPL-class numerical workloads
Different unit and scope: one accelerator, LLM decode phase, joules per generated token — and a comparison between precisions rather than a league table
Workload-agnostic trackers: sample RAPL/NVML while your job runs and convert to CO₂e with grid-intensity factors
Complementary, not overlapping: they instrument whatever you run, we fix the workload (256 tokens, batch 1, single stream) so two precisions are comparable — and we publish no CO₂e, because that needs a PUE and a grid model we do not have
No TDP anywhere in our pipeline: every published point is an integrated NVML power trace, and anything modelled is labelled interpolated/extrapolated
Trademark note: MLCommons, MLPerf and MLCube are trademarks of MLCommons Association, referenced here nominatively. The maintainer is an individual observer member of MLCommons; EcoCompute is independently developed and is neither an official MLCommons benchmark nor endorsed by MLCommons.
Fitted crossover curve · your model marked with its uncertainty
Fitted curve95% band (fit instability)Measured anchors (n ≥ 2)Anchors measured once (n = 1, provisional)Independent replication (not fitted)Your model ± CIAbove zero = penalty · below = savings
Hollow anchors were measured once (n = 1, the RTX 4090 deep dive) and filled anchors come from the replicated main dataset (n = 2, CV < 2%); both feed the fit, but a hollow point carries no measured spread. The curve is a fitted extrapolation calibrated to the measured anchors (dots) — not new measurements. Beyond the largest measured anchor the slope is not measurement-anchored, and INT8 on non-A800 architectures is fitted. Treat large-model (≈≥7B) points as directional — see About → How we measure. What each fitted curve rests on: Ada NF4 9 anchors (RTX 4090 ×5, RTX 4090D ×4) · Ada INT8 6 (RTX 4090 only) · Blackwell NF4 4 · Turing NF4 4 · Ampere NF4 3 and INT8 3 (A800). Ada is the only class that pools two different cards, and they disagree by roughly 20 points at the same model size, so the Ada band is the widest of the four — see the methodology page for the leave-one-out error per class.
Share your exact model size + GPU + precision.
Report schema output (JSON)
From static query to constrained optimization: give your GPU, model size, an objective and optional
budgets — the tool exhaustively searches precision × batch × context, filters by your constraints and returns
the objective-optimal config, alternatives and the energy↔latency Pareto frontier. Energy is measured-anchored;
latency/throughput are a roofline model; VRAM is computed — each field is labelled below.
Non-dominated trade-offs: no other config is both lower-energy and lower-latency. Down-left is better; ★ is the recommended config.
Recommended (★)Frontier config
Share this constrained scenario + result.
Every number on this site is reproducible. The EcoCompute energy MLCube container runs the same
measurement on your GPU — direct NVML power sampling, no TDP guesses — and writes an
energy.json with the exact same fields the charts here use. Run it, then drop the result
below to overlay your measurement on the crossover curve. No GPU of your own? The
Colab notebook
does the same measurement on a free T4.
Full guide, output schema, scope and how to contribute a run: the container page.
1 · No GPU? Run the notebook in Colab
A free Colab T4 is enough — no GPU of your own, no Docker, nothing installed locally. The notebook runs the same NVML measurement as the container and writes the same energy.json, then prints an overlay link and a block of text you can paste into an issue.
It measures your chosen precision and its own FP16 baseline, in randomized order, waiting for the card to come back to idle before each arm — the two things we got wrong the first time and wrote up. Both arms have to fit: on a 16 GB T4 that means models up to about 3B, and the notebook refuses to start rather than failing with an out-of-memory error twenty minutes in. Budget 20–35 minutes; most of it is cooldown and the model download.
One pass is n=1 and energy is integrated from sampled power — on our RTX 4090 the GPU's hardware energy counter read on average 14.9% higher than integrating the same traces, so read these figures at that resolution. The last cell repeats both arms 5× if you want a repeatability figure. Same scope as everything else here: GPU-package power, not wall AC; not a certified benchmark result.
2 · Have a GPU? Run the container
One command, nothing to configure. Needs an NVIDIA GPU. With Docker it runs the prebuilt image; on a rented GPU instance that cannot nest containers (AutoDL, vast.ai …) the same command installs into a venv instead and runs the identical code. No GPU? It still runs and returns dataset-derived reference values, clearly flagged (never faked).
Measures NF4 and its own FP16 baseline on TinyLlama-1.1B, writes a schema-validated energy.json to ./ecocompute-out/ and prints an overlay link. The measurement itself takes a few minutes; the first run is dominated by downloads — the one-time image pull (or dependency install) plus a ~2 GB model download — and later runs reuse the caches. Our one timed end-to-end run took 57 minutes on a China-hosted rented RTX 4090 (mostly fetching torch/CUDA wheels; since fixed to use a domestic index, but not re-timed). No flags: the architecture comes from the NVML device name, so your card cannot be mislabelled. Other models/precisions and the plain docker run form: the container page.
Repo & full guide: github.com/hongping-zh/ecocompute-mlcube. This is a supplemental energy-methodology container (MLCube-compatible), not a certified benchmark. The script ends with a link like quantenergy.tech/?tab=run&overlay=… — the point is encoded in the URL, so opening it restores your marker below with nothing uploaded.
3 · What you get — the same structure as this site
Example energy.json. The two fields the charts read are highlighted: vs_fp16_energy_pct (ΔE% vs FP16) and basis (measured / interpolated / extrapolated).
Shown here is the shipped example (examples/energy.measured.illustrative.json): its power/throughput numbers are synthetic only to illustrate the output shape. When you run on a real GPU, the same fields carry your actual NVML measurement (basis: "measured").
4 · Overlay your result on the crossover curve
Drop your energy.json here, or click to choose a file
ModelGPUPrecision
ΔE vs FP16source
Fitted curve (your GPU arch)95% band (fit instability)Measured anchors (n ≥ 2)Anchors measured once (n = 1, provisional)Your energy.json
Your point is placed at (model size, ΔE%) from the uploaded report and coloured by its basis. The fitted curve is calibrated to measured anchors for the report's GPU architecture — filled dots are replicated (n = 2), hollow dots were measured once (n = 1) — and beyond the largest anchor it is extrapolated. Nothing is uploaded to a server; parsing is 100% in your browser.
Compare several runs — drop more files to stack points.